In order to better manage your business from your back office and make the best strategic decisions for your streaming platform, OKAST has set up a number of KPIs. What are the available analytics?
TABLE OF CONTENTS
In your back office, KPIs are available in several menus depending on their level:
- General KPIs apply to all projects and all content. This is the highest level of data relating to your organisation.
- The KPIs in the DASHBOARD menu display an overview of a specific project.
- The KPIs in the ANALYSIS REPORT menu display views segmented by theme (Content, Sales, Users, etc.) for a specific project.
General KPIs in the menu > MY ORGANISATION > Consumption
The general KPIs can be accessed via the menu > MY ORGANISATION > Consumption. They apply to all projects and all content. This is the highest level of data relating to your organisation.
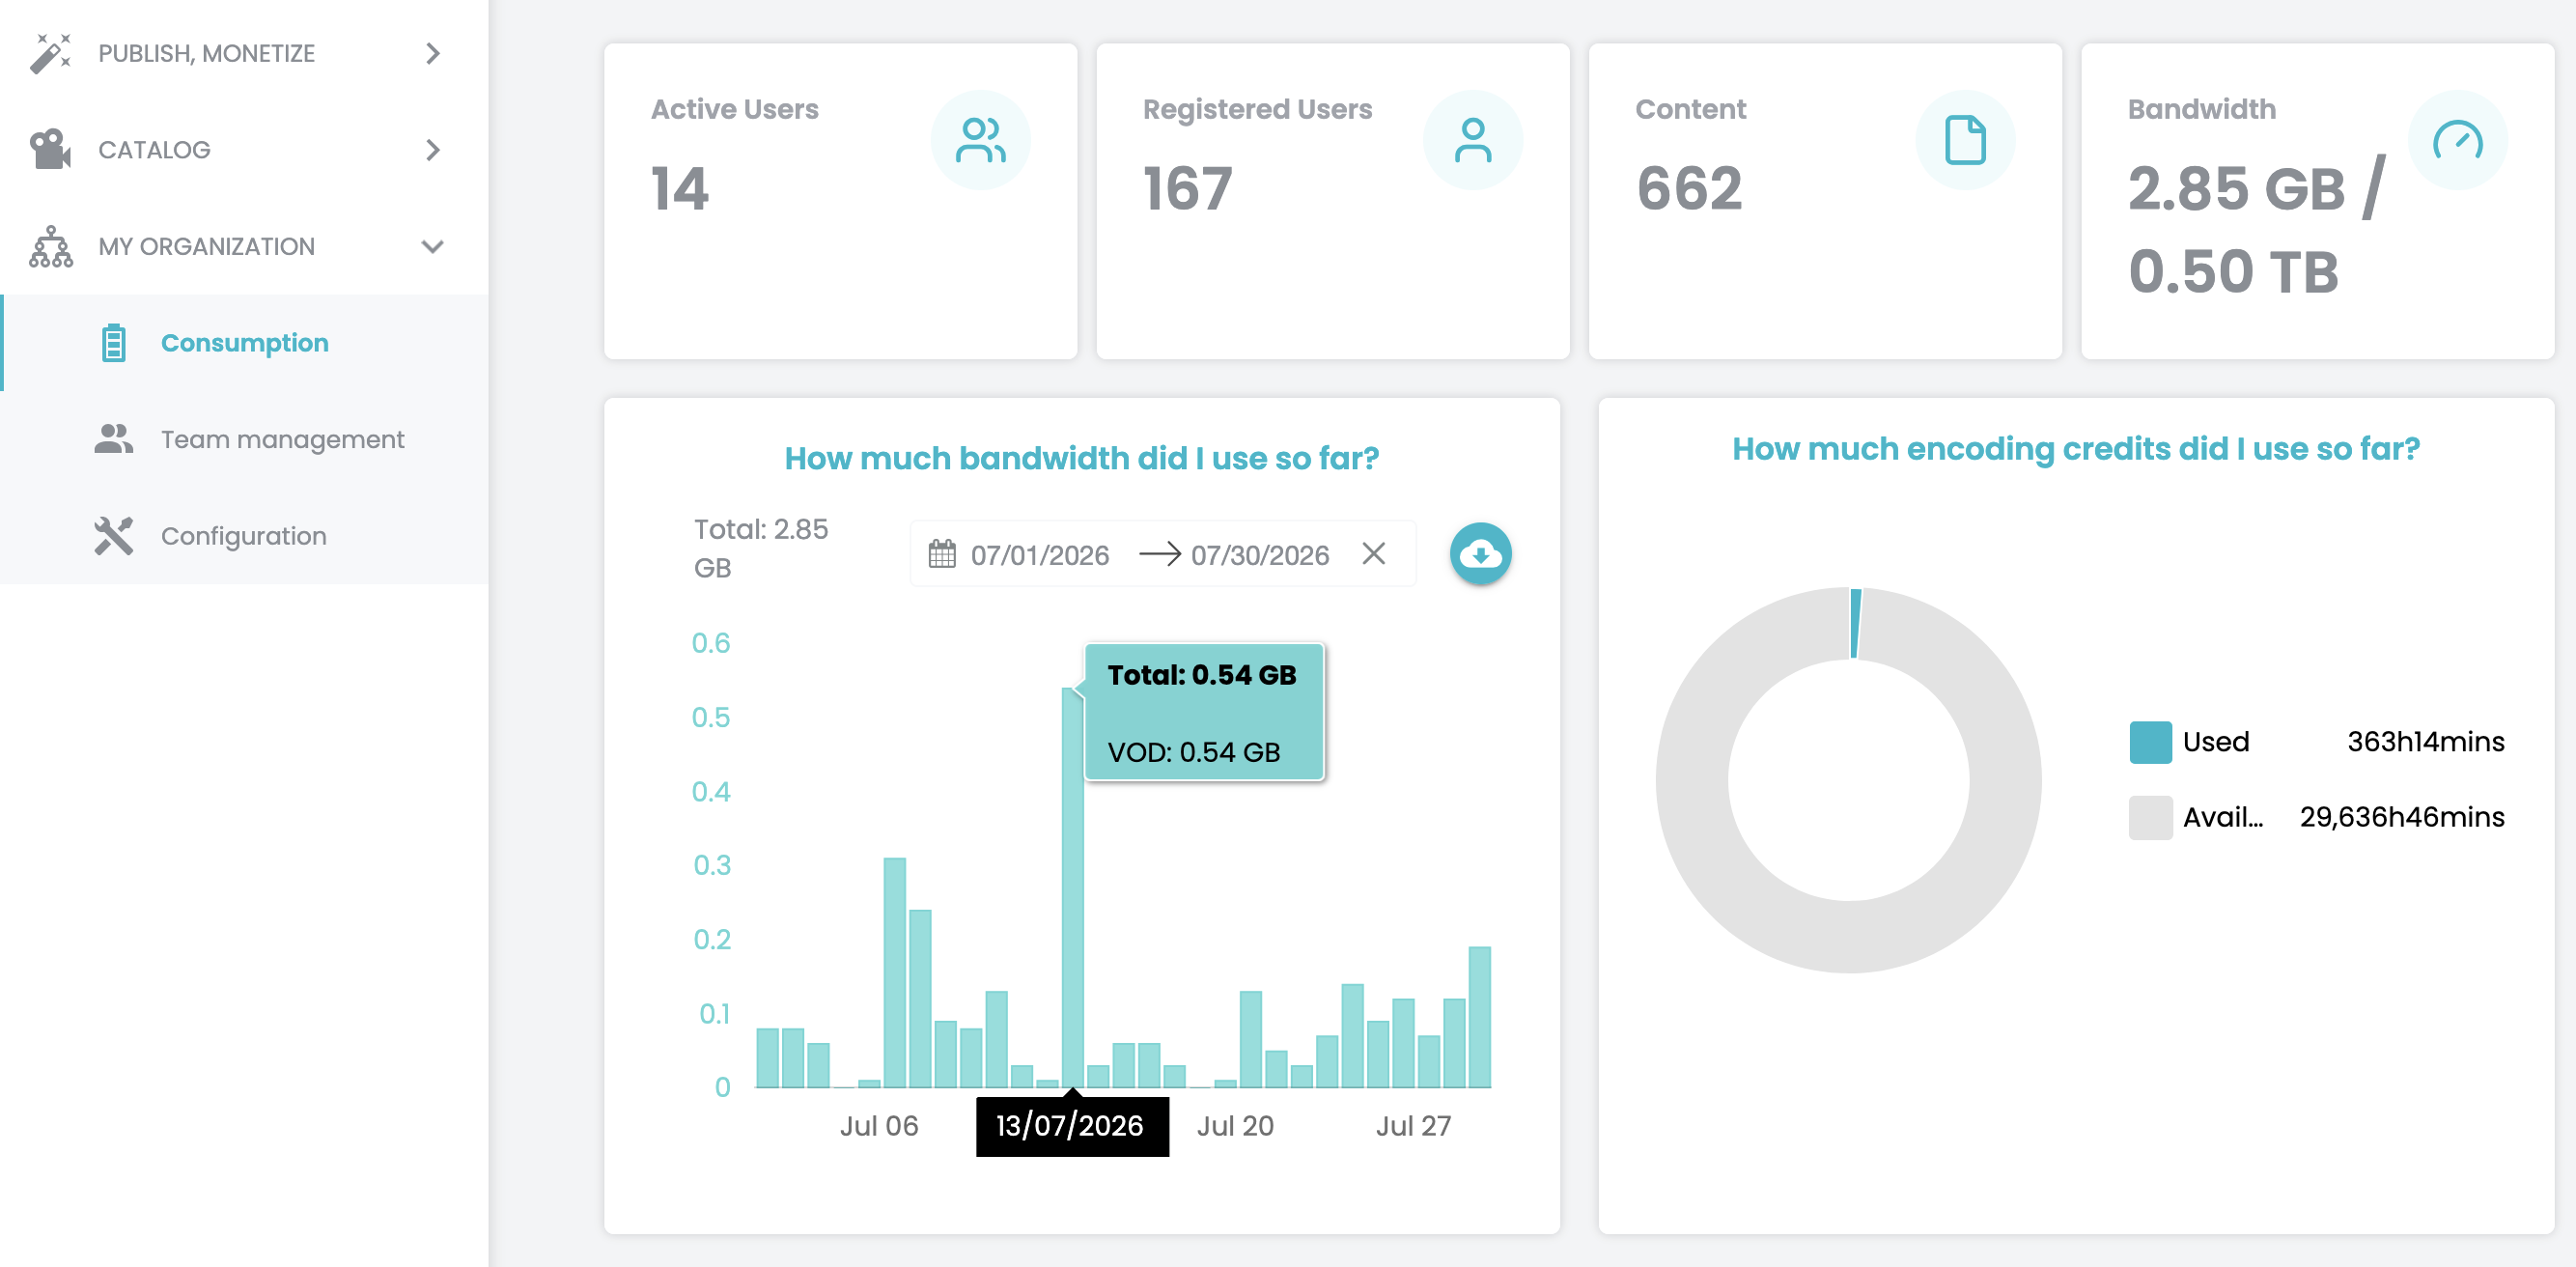
1- Four main indicators

- Active Users: the number of users who have subscribed to one of your offers.
- Registered Users: the number of registered users, including those who have subscribed to one of your offers and those who have only registered on your platform but not subscribed to an offer.
- Contents: the number of contents created, all projects included. Attention: this also concerns the content files created for which no content has been uploaded. If you want to know the difference, you will have to go to the menu Content management > Catalog and filter according to their status.
- Bandwidth: the bandwidth usage for the current month compared to the maxim
2- Bandwidth

This widget allows you to see the bandwidth usage in the form of a bar graph and with the possibility to change the time range to observe the bandwidth usage.
So you can see the usage of the same day, the day before, the week, the month, the last 3 months, the last 6 months, the current year or since your registration.
3- Encoding credits

This widget allows you to observe the encoding credit you have used compared to the available encoding credit. As a reminder, this credit is fixed and not updated every month.
The KPIs in a project
1- Registered users and active users

This widget allows you to see the number of registered users and the number of active users on your project.
You can see this data in a bar chart format and with the possibility to change the time range to observe and compare active and registered users: same day, previous day, week, month, 3 months, 6 months, year or since your registration.
You can choose the platform of your choice on which your project has been deployed (Web, Android, iOS, Smart TV, etc.).
2- Number of contents’ views

This widget allows you to see the number of content views. You can see this data in the form of a bar chart for the data at the time and in the form of a curve for the cumulative data.
You can change the observation time range: same day, previous day, week, month, 3 months, 6 months, current year or since your registration.
3- The location of your users and views of your content

Here you can localize your users and content views on a country-by-country basis and by varying the observation time range. By choosing the Users mode and selecting a particular country, you can find out the number of registered users.
By choosing the Total views mode and selecting a particular country, you can know the number of free views (for views on content included in your free offers) and the number of paid views (for views on content from your paid offers).
4- Devices views

You can also see the details of viewing sessions by device: TV, computer, game consoles, tablets or mobiles
Note: for the different KPI’s, by clicking on the button ![]() you can make a CSV export of the selected data.
you can make a CSV export of the selected data.